No products in the cart.
AOD Pump News
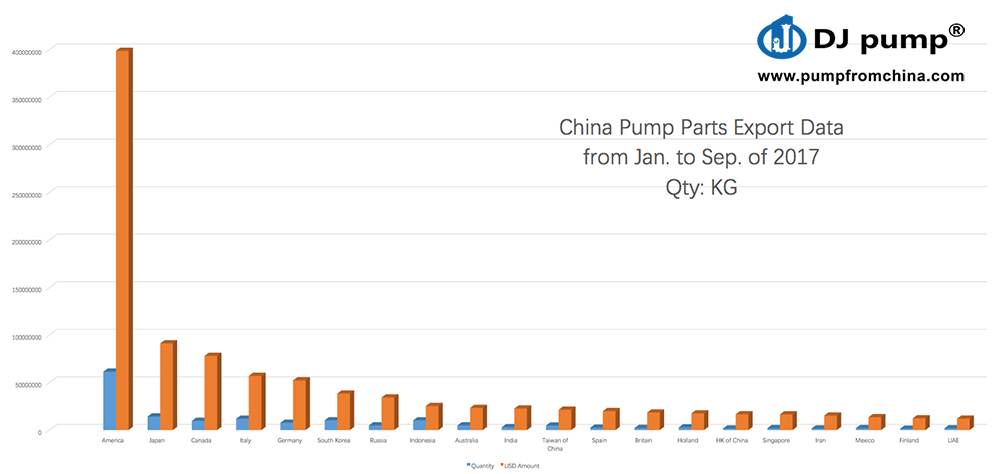
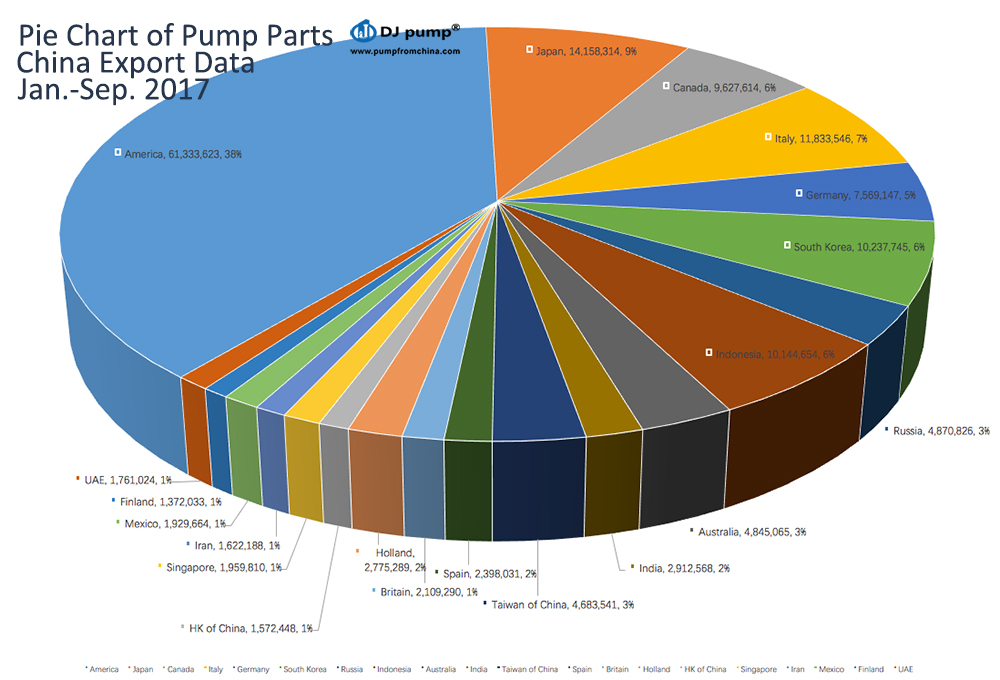
China Pump Parts Export Data from Jan. to Sep. of 2017
Here lists the top 20 Region of Export Data from Jan. to Sep. of 2017.
Table of the export data of pump parts
| Commodity | Unit | Country/Region | Quantity | USD Amount | YoY±% | |
| Quantity | USD Amount | |||||
| 84139100 Pump Parts | KG | America | 61,333,623 | 398,736,381 | 26.1 | 30.9 |
| Japan | 14,158,314 | 91,097,855 | -3.2 | -6.7 | ||
| Canada | 9,627,614 | 77,913,556 | 68.4 | 71.7 | ||
| Italy | 11,833,546 | 56,893,154 | 6.8 | 8.6 | ||
| Germany | 7,569,147 | 52,151,177 | 0.4 | -7.7 | ||
| South Korea | 10,237,745 | 38,346,077 | 0.9 | -4.7 | ||
| Russia | 4,870,826 | 34,227,649 | 35.8 | 22.6 | ||
| Indonesia | 10,144,654 | 25,251,526 | -24.3 | -10.9 | ||
| Australia | 4,845,065 | 23,286,777 | 60.5 | 43.9 | ||
| India | 2,912,568 | 22,585,882 | 47.3 | 28.9 | ||
| Taiwan of China | 4,683,541 | 21,342,630 | 31.0 | 22.6 | ||
| Spain | 2,398,031 | 19,911,902 | -8.5 | -7.4 | ||
| Britain | 2,109,290 | 18,344,979 | 36.6 | 38.6 | ||
| Holland | 2,775,289 | 17,502,775 | -10.1 | -8.7 | ||
| HK of China | 1,572,448 | 16,566,421 | -9.4 | -3.5 | ||
| Singapore | 1,959,810 | 16,453,480 | 60.7 | 28.0 | ||
| Iran | 1,622,188 | 15,234,093 | 33.2 | 31.6 | ||
| Mexico | 1,929,664 | 13,467,178 | 35.4 | 35.1 | ||
| Finland | 1,372,033 | 12,302,409 | 34.4 | 42.6 | ||
| UAE | 1,761,024 | 11,909,889 | 158.7 | 97.2 | ||
| Thailand | 1,266,204 | 11,399,278 | 19.5 | 10.6 | ||
| Pakistan | 760,463 | 10,496,270 | 55.9 | 167.9 | ||
| France | 2,032,619 | 9,363,633 | -7.0 | 14.0 | ||
| Turkey | 1,003,258 | 9,063,575 | 64.5 | 47.9 | ||
| Hungary | 1,932,666 | 7,880,703 | 18.4 | 10.4 | ||
| Denmark | 1,248,056 | 7,664,242 | -11.5 | -34.6 | ||
| Vietnam | 885,538 | 7,612,923 | 31.1 | 45.3 | ||
| Sweden | 795,559 | 7,417,756 | 33.7 | 24.8 | ||
| Poland | 760,685 | 6,899,806 | 44.7 | 14.8 | ||
| Brazil | 720,685 | 6,780,253 | 66.9 | 30.5 | ||
| South Africa | 1,583,009 | 6,568,752 | 56.4 | 30.1 | ||
| Congo (gold) | 353,285 | 6,356,564 | 77.3 | 65.5 | ||
| Egypt | 996,402 | 5,756,122 | -15.1 | 17.1 | ||
| Kazakhstan | 1,148,022 | 5,295,482 | 105.4 | 110.3 | ||
| Saudi Arabia | 764,838 | 5,171,096 | -4.9 | -1.9 | ||
| Malaysia | 725,005 | 5,165,724 | -17.8 | -23.2 | ||
| Ireland | 1,471,054 | 4,806,785 | 21.0 | 18.9 | ||


